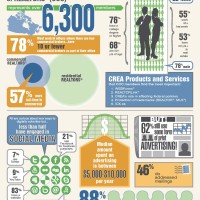
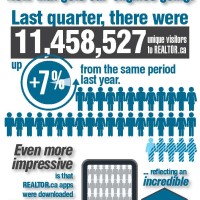
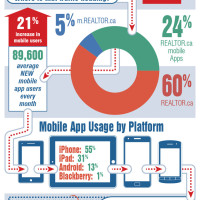
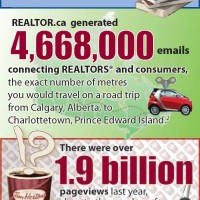

“Infographics” are the graphic representation of data or information in easy visual chunks. Presenting the information by image can make large concepts easier and quicker for larger audiences.
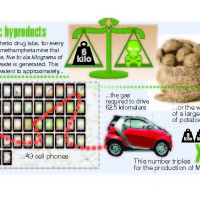
Large numbers and abstract concepts are more easily grasped if they can be converted into a graph or image. Not everyone can visualize, say 4kg, but pretty much everyone can imagine a sack of potatoes.
Click on gallery thumbnail for larger full image
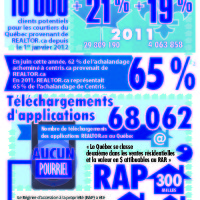
These are some of the infographics I developed for the Canadian Real Estate Association [2011-2017].